One machine runs our CI, our local LLM inference, and our production web stack. It also sits in a room where people work. Those four facts are in tension, and resolving them took two revisions, one wrong diagnosis that cost a week of throughput, and a measurement that showed our original resource split was backwards.
This is the account of what we changed, what we tried and rejected, and what the numbers looked like afterward. If you are tuning a local LLM box that has to share a room with humans, the useful part is not our final core list - it is the reasoning that produced it.
The setup
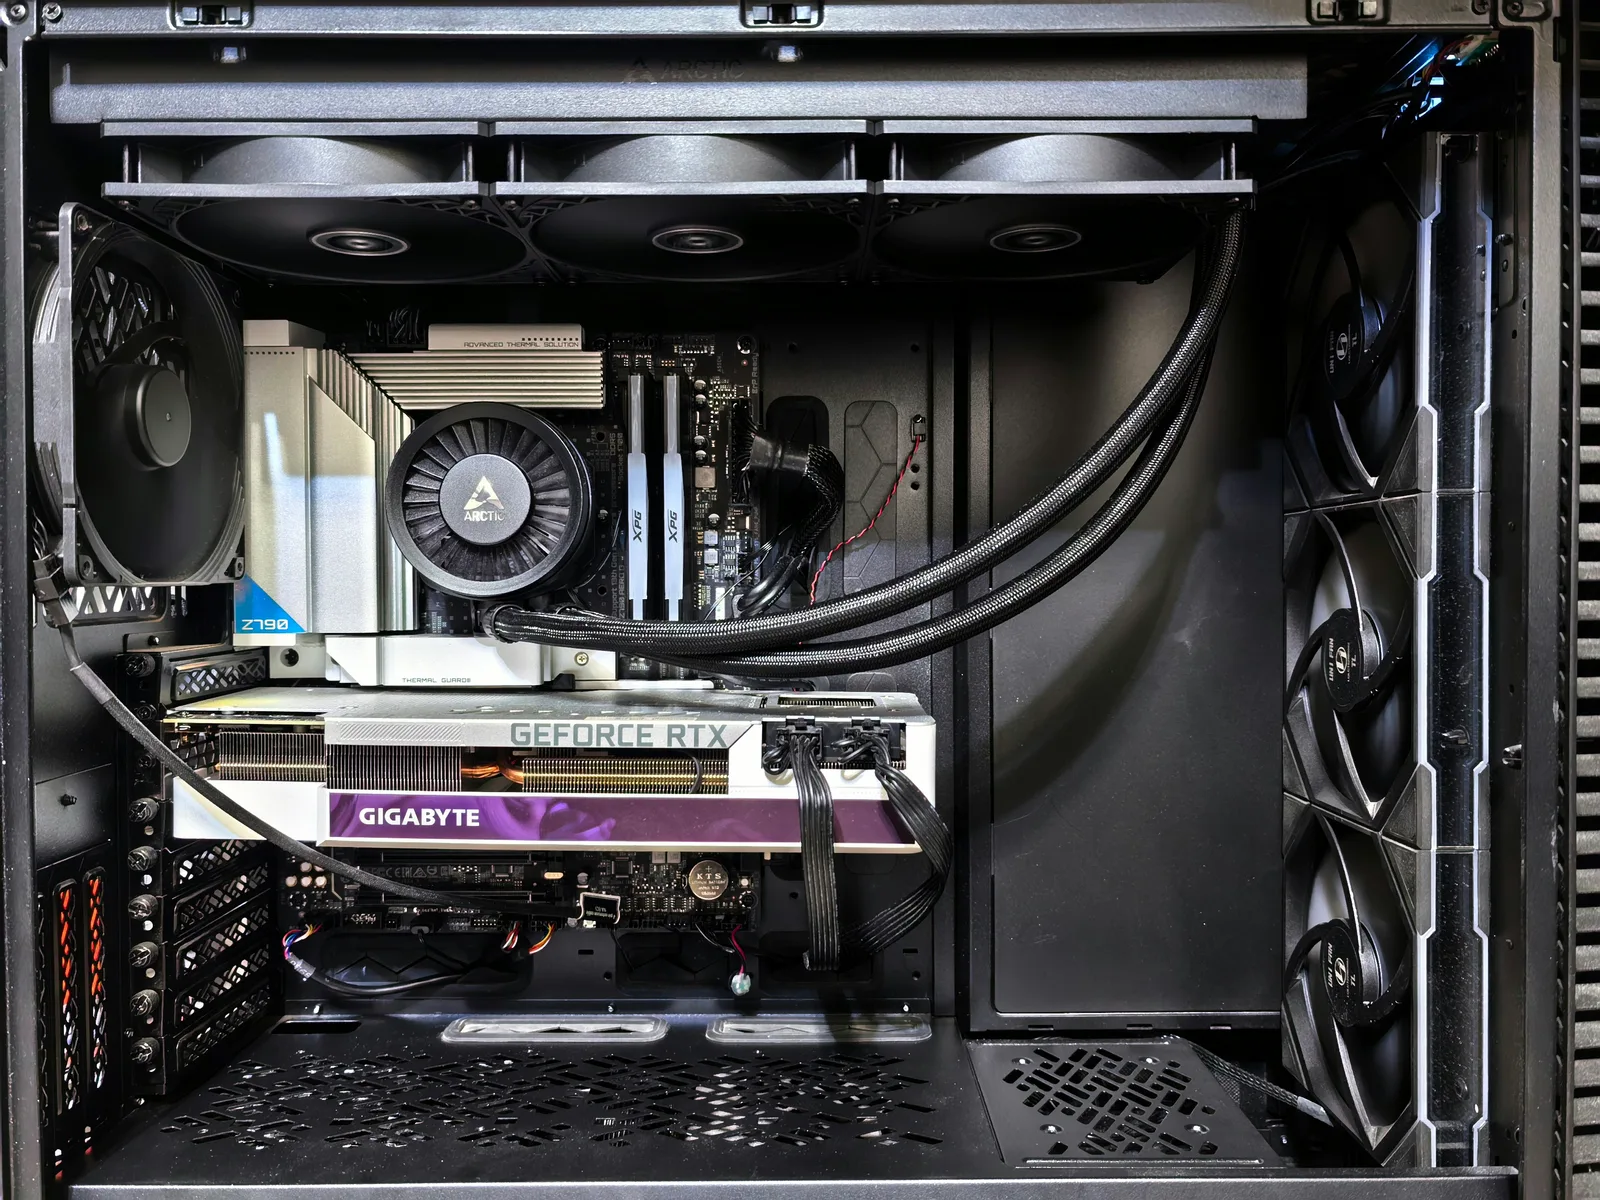
- CPU: AMD Ryzen 9 9950X, 16 physical cores / 32 threads, boost to 5.76 GHz
- GPU: 2x NVIDIA RTX 5090, 32 GB each, driver 595.71.05
- RAM: 64 GB, deliberately two DIMMs (four was unstable on this board)
- Tenants: Forgejo CI, a SGLang inference lane serving Qwen3-Coder-Next at 256K context, and the production web and database containers
Three co-tenants with completely different demand shapes. CI is bursty and wants every core it can get. Inference is GPU-bound and barely touches the CPU. Production web needs low latency and almost no throughput. The one thing they share is a thermal budget and a fan curve.
The problem: a shared box has two scarce resources, not one
The obvious framing is that CI and inference compete for CPU cores. That framing is incomplete, and acting on it alone is what broke things.
Core count and clock speed are independent axes. A cpuset bounds how many cores a workload may use. It says nothing about how hard each of those cores clocks. A 9950X will happily run four cores at 5.7 GHz and high voltage, and voltage is what heats the die and spins the fans. You can pin CI to a quarter of the machine and still make the room loud.
Both axes need a bound, and - this is the part that bit us - both bounds have to name the same cores.
What we measured before changing anything
The original allocation gave CI four physical cores and reserved twelve for inference plus production. That split was set when CI was small and was never re-derived from measurement.
So we measured steady-state non-CI CPU on a loaded box:
| Process | CPU |
|---|---|
| next-server (production web) | 13.2% |
| sglang::scheduler (both TP ranks) | 6.7% combined |
| gitea | 1.7% |
| postgres | 1.6% |
| cloudflared | 0.4% |
Total: roughly 0.2 of one core. The inference lane is GPU-bound and barely touches the CPU at all. We had reserved twelve physical cores for a workload that used a fifth of one, while CI - the actual throughput bottleneck - was squeezed into four.
The reservation was backwards. That single measurement drove everything that followed.
Solution 1: invert the lanes, do not resize them
We swapped the two blocks rather than picking new numbers:
| Threads | Owner | Policy |
|---|---|---|
| 4-15, 20-31 (12 physical cores) | CI, job containers, buildkit | cpuset-pinned, capped at 4.5 GHz |
| 0-3, 16-19 (4 physical cores) | SGLang, prod app and db, Forgejo, registry, ingress | cpuset-pinned, full 5.76 GHz boost |
Four physical cores is about 20x headroom over measured demand and leaves real room for production burst.
The protected lane gets cores 0-3 for three reasons that all point the same way. The 9950X is two CCDs with separate L3 caches, and the ranking data shows CCD0 is the better-binned die - cores 0-7 rank 206-236 against 166-201 for cores 8-15. Cores 0-3 are the top of that whole range. The protected lane is also the uncapped lane, so the bin quality is actually usable. And the kernel already prefers to land IRQ and housekeeping work on the low cores, which is exactly the latency-sensitive traffic.
Rejected: a clean 8/8 CCD split. It looks tidy on a two-die part and keeps each lane inside its own L3. We rejected it because it hands eight cores to a 0.2-core workload and costs CI a third of its lane for no measured benefit. Symmetry is not a goal. The cost of CI's spill onto cores 4-7, which share CCD0's L3 with production, is tolerable precisely because the protected lane's working set is tiny and mostly I/O-bound against a millisecond budget.
Rejected first, then reverted: the natural-looking assignment. Putting CI on cores 0-11 and production on 12-15 reads better. We implemented it and backed it out, because two CI workflow files hard-coded a buildkit pin to cores 12-15 and re-asserted it on every single build. Under the tidy layout, that line dragged the heaviest compile on the machine directly onto the protected inference and production cores, at full boost, several times an hour. We chose the lane that contained the hard-coded set until we could remove the hard-coding.
Solution 2: cap the frequency, and re-test the cap when the lane changes
CI cores are capped at 4.5 GHz, stripping the top ~1.2 GHz of the boost range. Heat scales roughly with V²·f, so removing the top of the voltage/frequency curve is a large acoustic win for a small throughput cost.
The cap was originally set against a four-core lane. Tripling the lane invalidates that reasoning - twelve capped cores can plausibly out-heat four uncapped ones - so we re-measured rather than assumed. Identical synthetic load, stress-ng --cpu 24 pinned to the CI threads, 45 seconds to thermal steady state, then a 15-second RAPL energy window:
| 12-core CI lane | Package power | Tctl | Avg clock |
|---|---|---|---|
| Capped at 4.5 GHz | 134.3 W | 62 °C | 4520 MHz |
| Uncapped | 200.0 W | 82 °C | 5075 MHz |
+49% package power and +20 °C to buy +12% clock. The clock only reaches 5.08 GHz rather than the nominal 5.76 because an all-core load is already power-limited, so uncapping pays nearly the full thermal price for a fraction of the advertised boost.
Uncapped also puts Tctl within 13 °C of Tjmax in a room people sit in. We kept the cap. The ~11% clock cost shows up as roughly 10-15 seconds on a test job against a 900-second budget, which is irrelevant, while the acoustic saving is the single largest lever on this machine. The cap is what made widening the lane to twelve cores acceptable in the first place.
Rejected: leaving the lane uncapped after widening it. The throughput was genuinely better. It was not worth 82 °C and the fan noise.
The trap: we moved one axis and left the other behind
When the lane was widened from four cores to twelve, the cpuset moved and the frequency cap did not. The cap stayed pointed at cores 12-15 - cores CI had partly left - while CI ran twelve cores at full boost with no thermal bound at all. This ran live for about two hours, and the cap was silently protecting nothing.
The failure mode is worth naming, because nothing alerts on it. Both configs looked reasonable in isolation. Each was internally valid. They simply named different cores, and no check compared them.
There was a second live consequence: the cap script's own pin commands still carried the old core list, so the next boot or service restart would have yanked CI back to four cores. That would have surfaced weeks later as an unexplained throughput regression with no obvious cause.
Solution 3: one value, everything else derived
The fix is structural rather than careful. The --cpuset-cpus= line in the CI runner config is now the single source of truth. Everything else reads it:
- The cap script greps it and derives the cores to cap, the complement to restore to full boost, the runner and buildkit pins, and the protected-container pins
- The runner installer reads the same value for the builder cpuset
- Both CI workflows read it through a shared script, so no core list appears in workflow YAML
Changing the lane is now editing one number. A capacity change is one number.
Two details that carry beyond our setup:
Restoring matters as much as capping. When the lane moves, the vacated cores must have their boost restored, or the cap silently penalises the tenant that just inherited them. Half the drift bugs in this class are a forgotten restore.
Refuse to run on a malformed config rather than falling back. The derivation script has no default lane. A missing or ambiguous config exits non-zero and fails the build. A wrong cpuset that looks fine is worse than a red build, because it would pin the heaviest compile on the machine onto the protected cores and nobody would notice.
Rejected: adding a cpuset key to the compose file. Docker's docker update --cpuset-cpus writes to the running container only. A container recreate resets the cpuset to empty, and our deploy pipeline recreates the production app on every merge - so the app silently lost its pin and floated onto capped CI cores. The obvious fix is to declare the cpuset in compose. We did not, because that reintroduces exactly the duplicated-core-list defect the whole revision existed to remove. Instead a systemd timer re-runs the same derived script every two minutes. It compares before writing and logs only actual changes, so the journal shows real drift events rather than a heartbeat. We verified it end to end by deliberately pinning the production app onto CI cores and watching it heal in about 90 seconds.
There is a systemd detail here that cost us a debugging session. The first version of the timer used OnUnitActiveSec=2min and fired exactly once. A Type=oneshot unit without RemainAfterExit goes active then inactive instantly, so systemd computed a next-elapse of infinity and slept forever. OnCalendar is state-independent and cannot fail that way. Check liveness on the timer, not the service.
GPU: the floor is the only knob worth using
Both 5090s are capped at 400 W, down from a 600 W default. That is the minimum the card allows, so it is as low as the power limit goes on these parts. Two 600 W cards in one room is the loudest thing here under load, and the serving throughput cost for our inference workload is modest. Persistence mode stays enabled to avoid per-invocation driver init.
The cap resets on reboot, so it is applied by a root systemd oneshot after the persistence daemon.
Not used: SM clock locking. nvidia-smi -lgc gives finer control than a power limit. The 400 W cap alone got us where we wanted, and one lever is easier to reason about than two.
The best CPU fix we found was a GPU-lane flag
SGLang's scheduler defaults to busy-polling a non-blocking ZMQ receive. That pins one CPU core per tensor-parallel rank at 100%, at idle, forever. With --tp 2 that is two cores burning constantly for no work.
Adding --sleep-on-idle swaps it to an event-driven poller that sleeps when idle. Measured idle went from 100% on two cores to 0.0% on two cores, with negligible wake latency.
If you are running local inference and your idle CPU looks busy, check for this pattern before you touch a single cpuset. It is a one-flag change that returned two full cores.
An aside on diagnosis: the failure that landed on a limit
Weeks earlier, CI capacity was cut from four concurrent jobs to three, attributed to "concurrent jobs sharing the Docker socket causing broken pipes during teardown bursts." That diagnosis was wrong and it cost about 25% of CI throughput for six days.
The actual signature was 29 timeout expiries, all on one day, zero before and zero since: eleven test jobs at exactly 300 seconds, twelve at 301 seconds, one at 600 and five at 601. Jobs terminating at precisely their configured budget are not a socket race. They are a budget that is too tight.
The amplifier was the CPU lane - four physical cores shared with a buildkit instance requesting six, roughly 3x oversubscribed, so any queue burst pushed tests past a ceiling that already sat at 72% of budget on a good day. The fix was raising the budgets and adding a structural timeout detector so a recurrence gets identified as a timeout rather than re-diagnosed as a socket fault.
A failure that lands exactly on a configured limit is a limit problem until proven otherwise.
Results
CI throughput, measured from job records:
| Window | Lane | Jobs/hr | Tests p50/p95 | Docker Build p50/p95 |
|---|---|---|---|---|
| Before | 4 cores, capped, capacity 3 | 223 | 210 / 217 s | 51 / 62 s |
| Intermediate | 12 cores, uncapped, capacity 6 | 364 | 174 / 183 s | 16 / 59 s |
| Final | 12 cores, capped, capacity 6 | - | 197 / 205 s | 14 / 47 s |
Over the wider measurement window: throughput went from 205 to 441 jobs/hr, queue depth from 39 to 0, static checks from 116/127 s to 90/91 s.
Re-applying the cap costs about 13% on test wall time against the uncapped window, consistent with the 11% clock reduction. Against the 900-second budget that is a p95/budget ratio of 0.23, inside our 0.3 ceiling, and a large improvement on the old 0.72.
Thermals under real three-to-six job CI load at the final allocation: mean Tctl 66.7 °C, peak 74 °C over a four-minute sample. About 21 °C below Tjmax, and 8 °C below the uncapped synthetic figure. Synthetic figures run hotter than real CI, which is more I/O- and memory-bound.
We kept nearly all of the throughput win and gave back none of the thermal headroom.
What generalises
- Measure demand before you reserve capacity for it. Our reservation was 60x the measured need and pointed at the wrong tenant. One measurement inverted the whole design.
- Bound both axes, and make them derive from one value. Core count and clock speed are independent. Two configs that name cores independently will drift, and the drift is silent.
- Re-validate a tuning parameter when the thing it constrains changes size. A cap set for four cores is not automatically right for twelve. Ours turned out to matter more at the larger size, not less.
- A failure landing exactly on a configured limit is a limit problem. Look at the budget before you invent a race condition.
- Check for idle busy-polling in your inference server. One flag returned two cores here.
- Prefer failing loudly over falling back to a default. A wrong resource assignment that looks correct is worse than a red build.
The room is quiet. CI is twice as fast. The inference lane never notices the difference.